Application Performance Monitoring
Splunk is a pure Big Data player that can continuously analyze the entire enterprise wide machine generated data in near real time, and provide complete application performance visibility for the IT Operation and continuous SLA/KPI measurement for the Business.
Application performance monitoring (APM) in Splunk is delivered by several main applications, as follow
Splunk Mobile Intelligence (MINT)
- Mobile Ops Dashboard (End-User Experience in APM)
- Business Transactions
- Errors (Deep Dive Component Monitoring in APM)
- Business Analytics and Reporting
Splunk Core
- Server-Side HTTP Response Time
- Client-Side Web Performance (End-User Experience Monitoring in APM)
- Network Round-Trip Time
Splunk IT Service Intelligence (ITSI)
- Glass Table (Runtime Application Architecture in APM)
- Service Analyzer
- RAW Data Analytics
Splunk Core
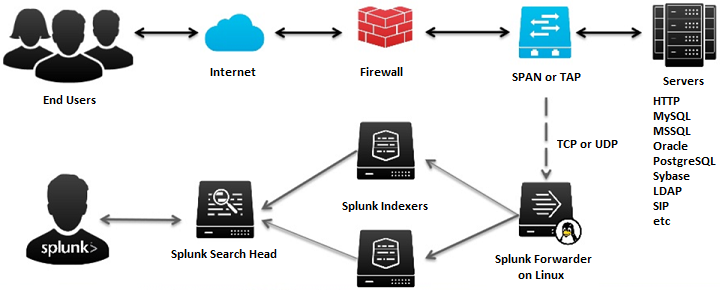
Splunk can index TCP and UDP packet from a SPAN or TAP network, thus it can measure network round-trip for each end-user request, as well as application response time for each service request to the servers. With packet data, patterns and anomalies at the application layer can be clearly seen even though the application itself doesn’t produce any log.
Server Side HTTP Response Time
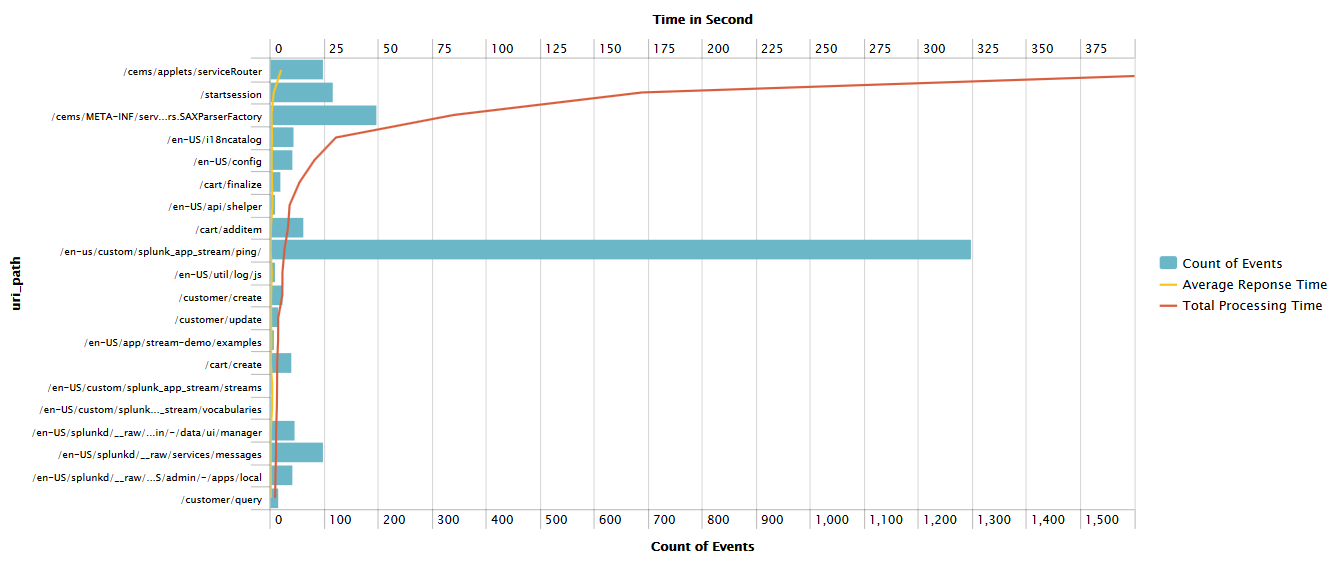
Fortunately, Splunk is smart enough to render Server-Side HTTP Response Time dashboard with 3 measurements at once:
- Most visited URL (see: Count of Events, as bar charts)
- Slowest URL (see: Average Reponse Time, as yellow line overlay)
- Longest overall processing time by URL (see: Total Processing Time, as red line overlay)
With such visualization, the overall performance bottleneck will be easily pin-pointed in the website. And soon after the performance is tuned on the top 5 worst performing URL, the overall server performance will significantly improved.
Client-Side Web Performance
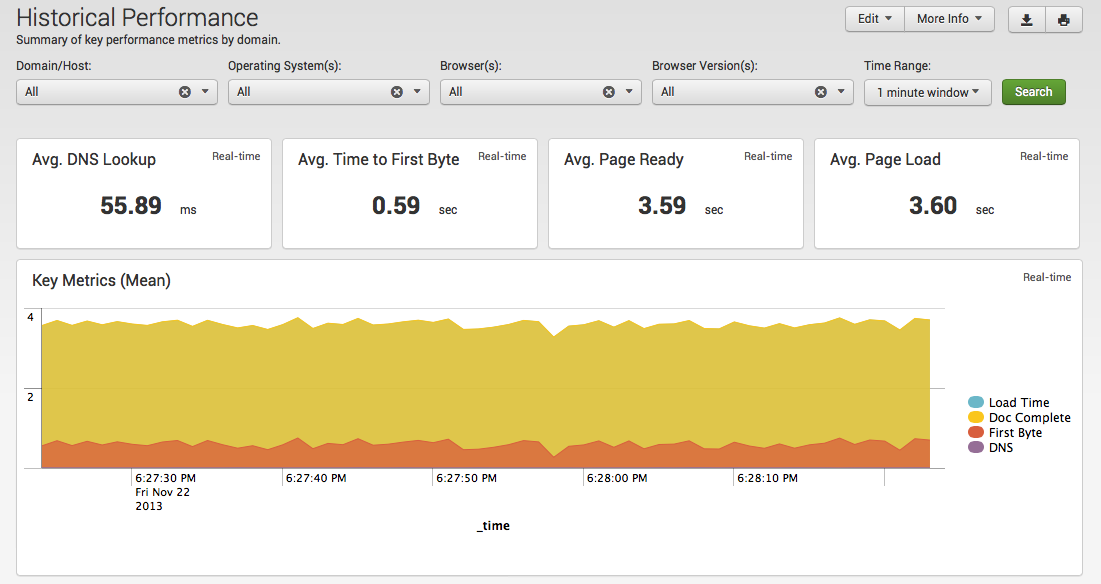
Splunk can measure client-side web performance by embedding javascript collector in the web page itself, thus we can measure how well is our web performance from the actual client point of view. Some of the most important measurement is Average Time to First Byte (response time), and Average Page Ready (transmission and loading time). These 2 measurements are critical for Application Development team to set the balance between design and performance.
Network Round-Trip Time
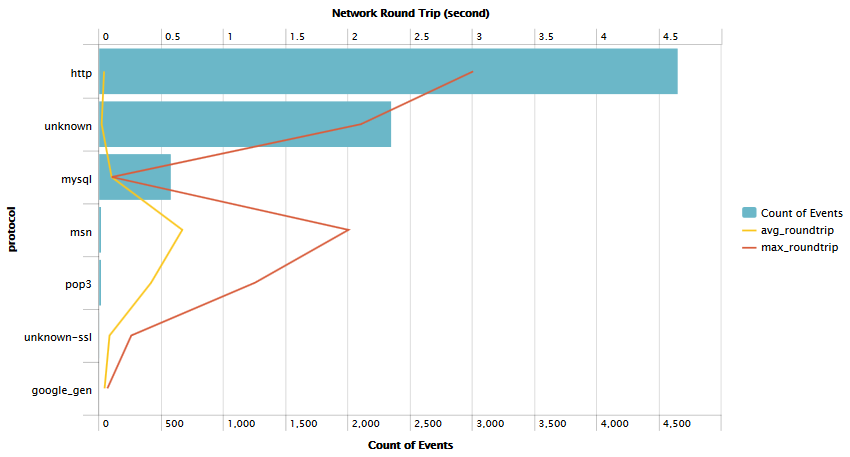
Network Round-Trip Time is very important for interactive web such as Web 2.0 applications, it is also useful when measuring client-side response time, but it can be widely vary from one service to another depending the payload size of each service. Actual network round-trip time in low bandwidth network is difficult to be measured because Ping round-trip time can significantly outperform POP3. That’s why Ping alone is not sufficient to measure round-trip time in Application Performance Monitoring. Therefore, HTTP round-trip time has to be calculated based on the actual client’s TCP ACK signal after each HTTP transmission from the server.
Thanks to Splunk that now we can easily visualize the actual round-trip time from the application point of view, we can even drill-down to measure round-trip for each URL which enable us to efficiently decide which image files need to be offloaded to external 3rd party Content Delivery Network like Akamai.
Splunk IT Service Intelligence (ITSI)
Glass Table (Runtime Application Architecture)
Glass Table has unique capability to show end-to-end performance dashboard on visual network topology, it help us to understand how our network topologies interact with application architecture, equipped with dashboards for each network/application node.
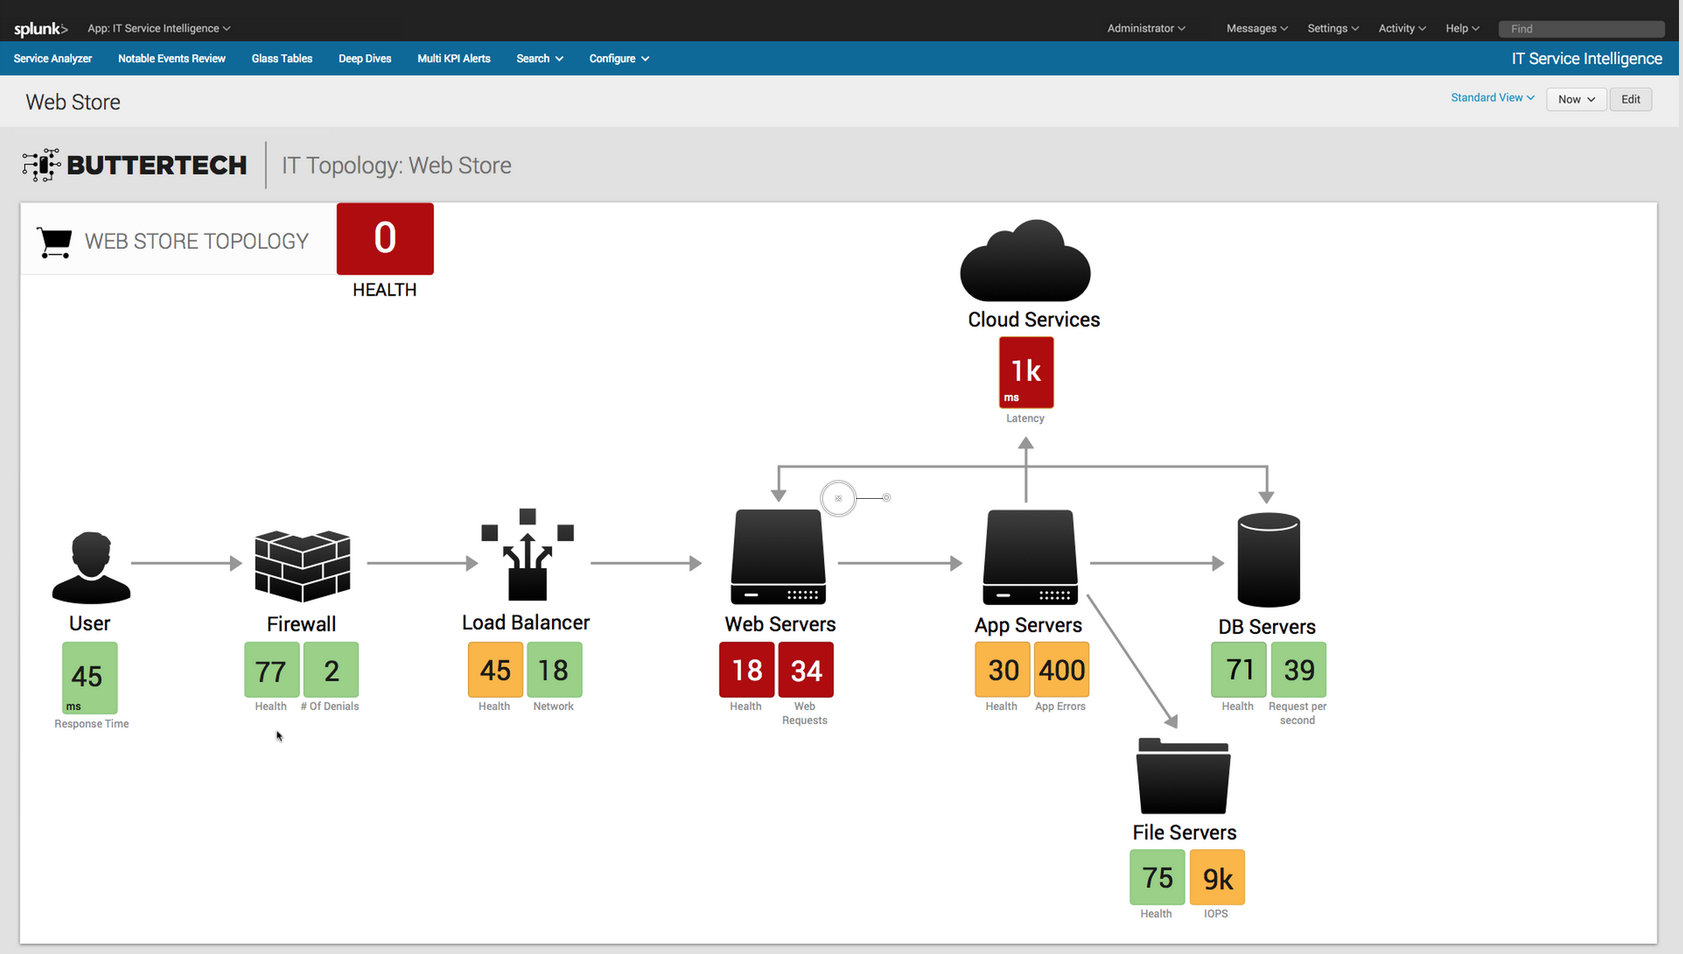
As can be seen on the upper right corner, there is a time picker (“Now” button), it can be changed into any specific time in the past to analyze previous service outages. Glass Table alone already save significant amount of time for troubleshooting, especially in a very complex application topology.
Service Analyzer
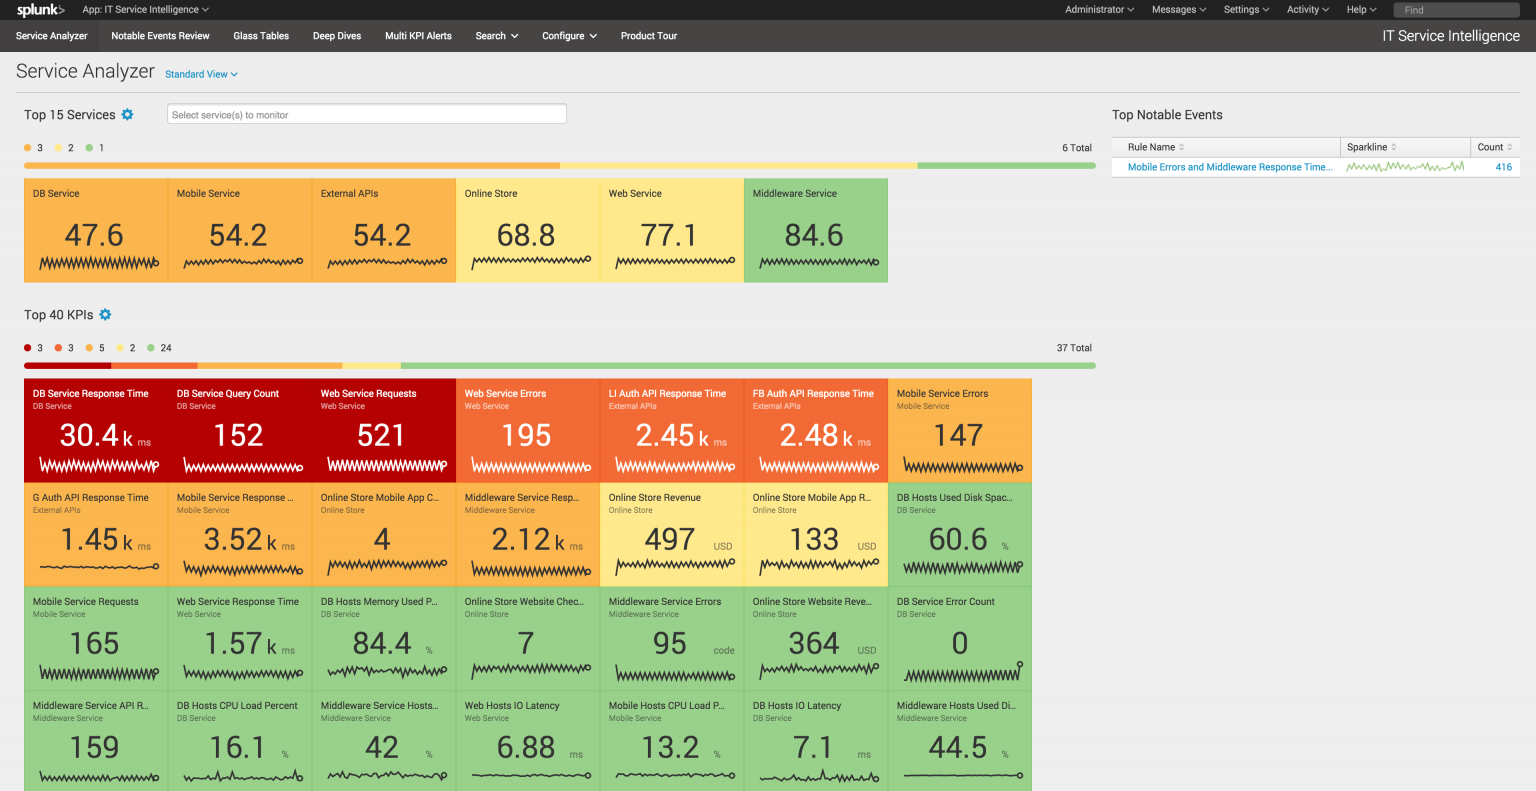
Service Analyzer is a dashboard containing collection of important KPIs for the business, while KPI itself can be composable from several sources. Several KPI can also be grouped into a larger KPI, and can be visible for a group of users. This feature let us prioritize the most critical KPI first.
RAW Data Analytics
Splunk collects raw data from various sources, and visualize them in group of KPI as parallel swim-lane to simplify trending analysis for each KPI. Each swim-lane can be expanded to analyze raw data which related to the KPI on that specific point of time.
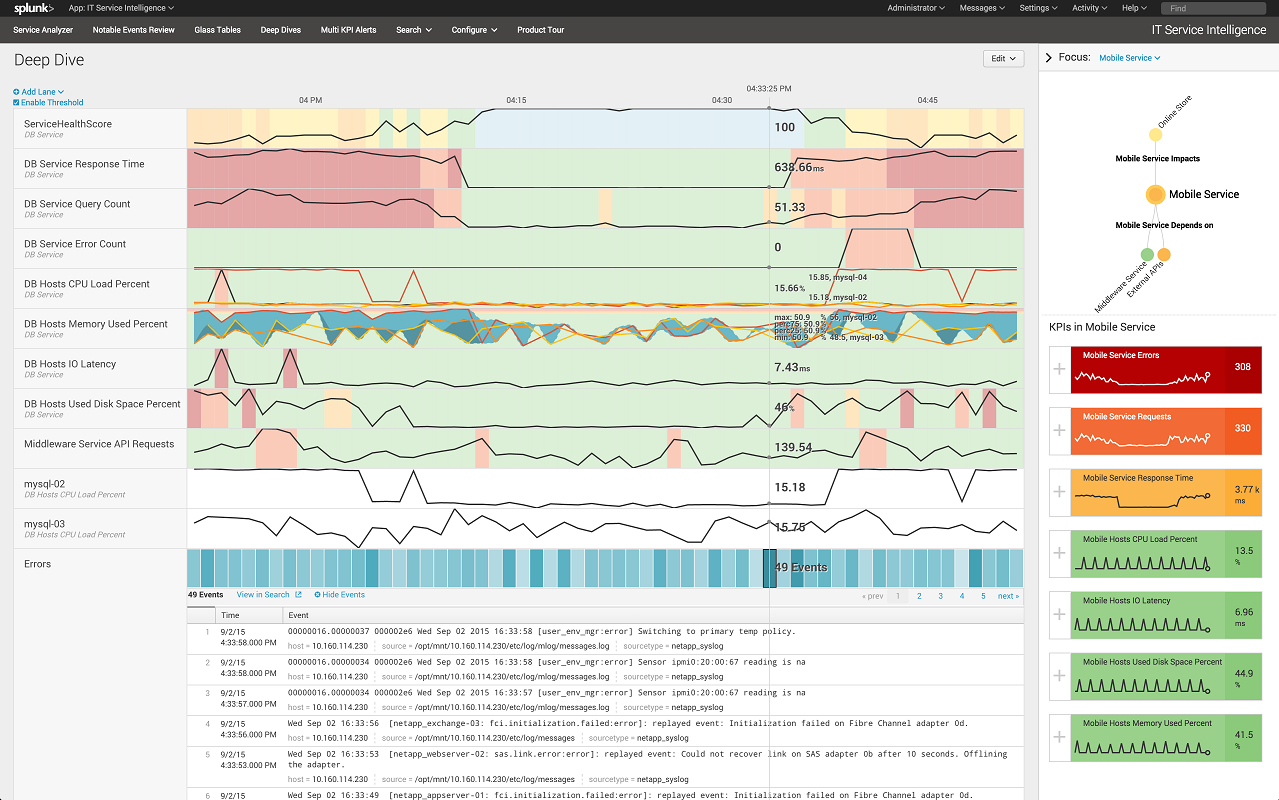
Splunk can also render different color on each swim-lane when it crosses certain KPI threshold, as can bee seen on the image above Health Score KPI becomes red/warning as the score falls, while Response Time KPI becomes red/warning when the score rises.
Splunk also has adaptive thresholding which built from the baseline of previous data, adaptive threshold can have different threshold values depending on the time of day.
Splunk Mobile Intelligence
Mobile Ops Dashboard
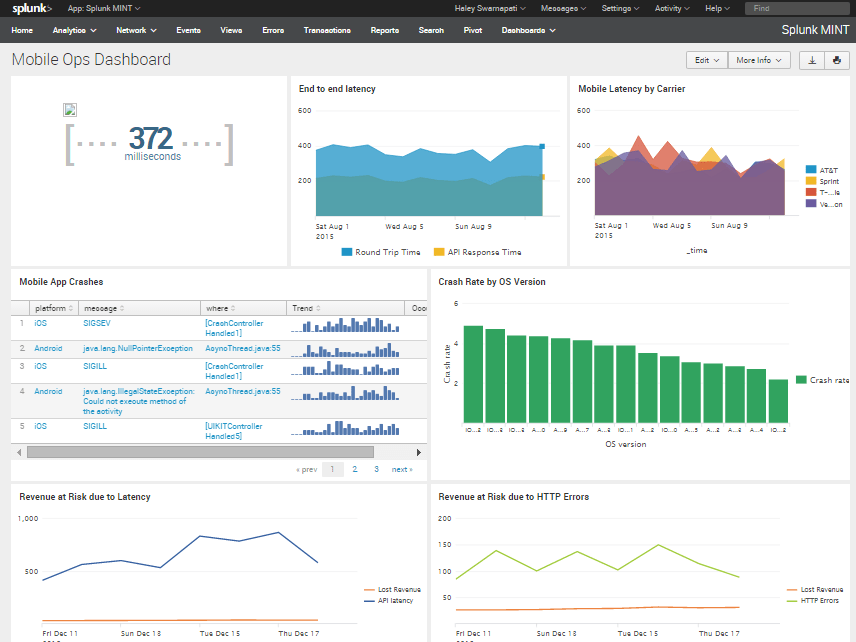
Mobile Ops Dashboard shows the overall performance of the network latency, end-to-end application latency, and crash rates. From this dashboard alone, we can already see the overall end user experience as well as its trend.
Business Transactions
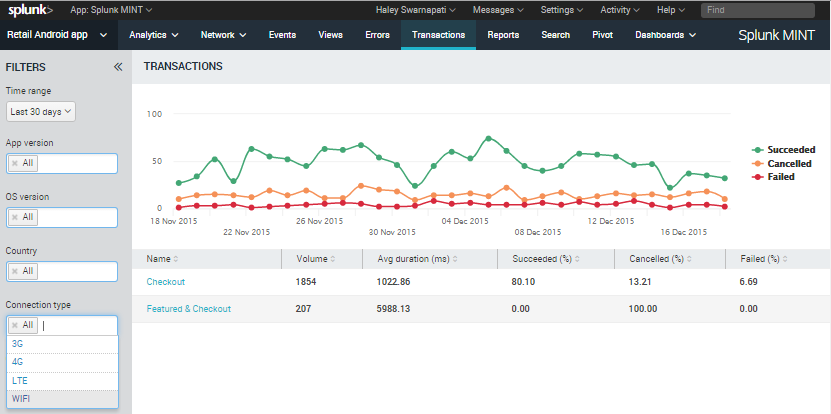
Application developers can put transaction name on every business critical function on the mobile application, and Splunk can measure the trend in time series chart. Several functions can be named uniquely or grouped into the same transaction name depending on the business requirement.
Errors (Deep Dive Component Monitoring)

Splunk can collect unhandled application exceptions and visualize it on a dashboard, the application developer can easily review which platform caused most of the exceptions, and can be drilled down further based on exception, platform, carrier, etc.
Analytics and Reporting
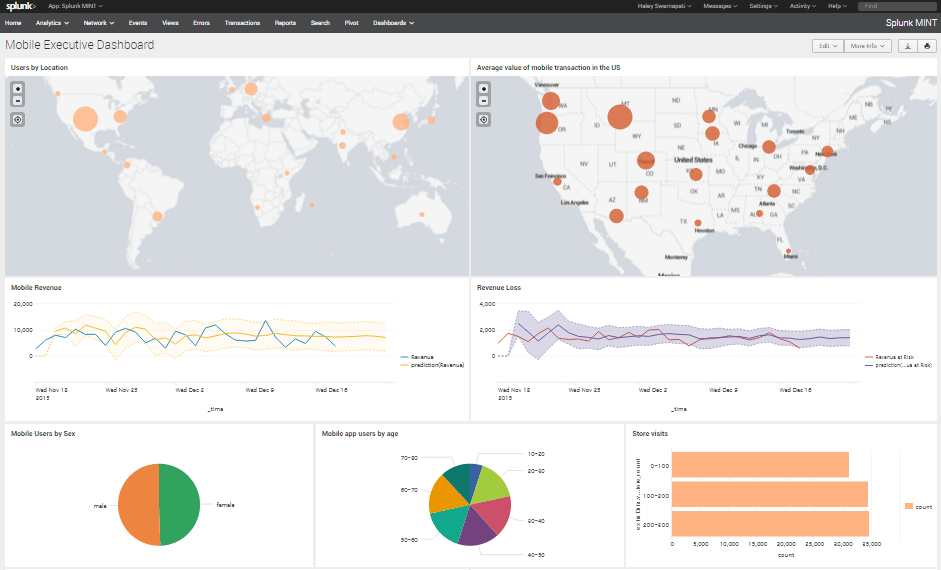
Let's
Get In Touch

